Breaking
Latest health news from South Africa and around the world•Wellness, nutrition, and fitness updates daily•Medical breakthroughs and healthcare updates•Science-backed health explainers and guides•Health tech, reviews, and upcoming events•
 SA Health News Desk
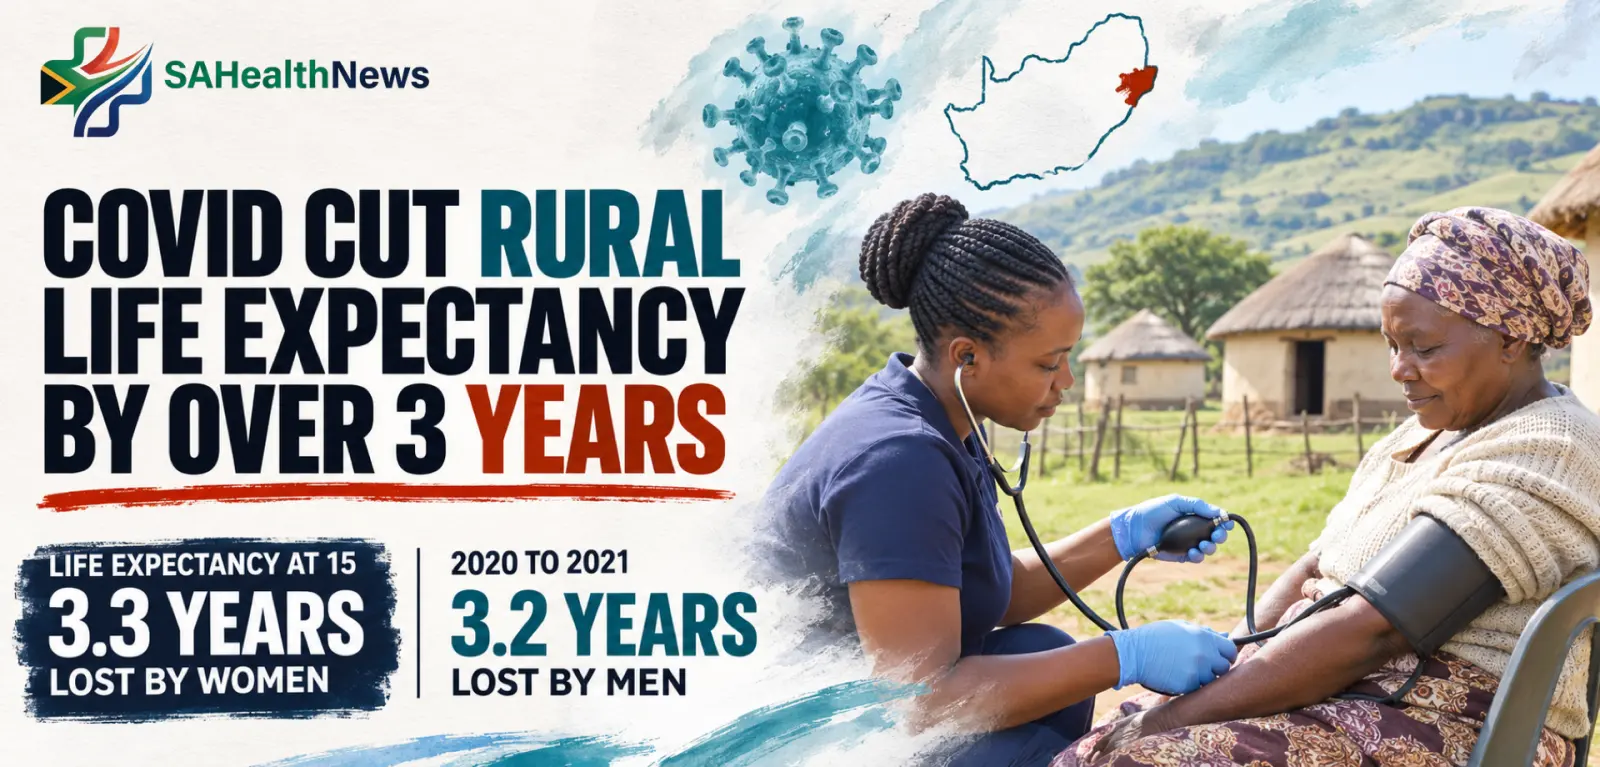
Life expectancy at 15 in rural uMkhanyakude fell by more than three years in 2021, an AHRI study of 130,710 northern KwaZulu-Natal residents finds.
Life expectancy at age 15 in rural uMkhanyakude, in northern KwaZulu-Natal, fell by 3.3 years for women and 3.2 years for men between 2020 and 2021. The drop came as the Beta and Delta waves of Covid-19 passed through the district. The finding is from a study led by the Africa Health Research Institute, published online in Population Health Metrics in October. It is a count of years taken off lives in one rural district, not a national league table, and not a verdict on any one household.
The study followed 130,710 people aged 15 and older, from 2015 to the end of 2021, through AHRI's population surveillance. That programme records births, deaths and moves in and out of the area's households. Over the seven years, 6,181 of those people died. The people in the file are residents of a place the institute has watched for years. They are not an anonymous sample drawn for a headline.
The researchers compared deaths in the pandemic period, from 5 March 2020 to 31 December 2021, with the number expected from the trend in the five years before. They found two spikes. One ran from November 2020 to February 2021, during the Beta wave. The other ran from July to September 2021, during the Delta wave. Across the whole pandemic period, deaths ran about 60% higher than expected.
Life expectancy here is life expectancy at age 15, the age at which the surveillance starts counting adults. It is not life expectancy at birth. Women outlived men throughout the study. In 2015, life expectancy at 15 stood at 70.1 years for women and 61.2 years for men. The men's figure had risen to 65.6 years by 2020, before the drop. The paper does not give a matching 2020 figure for women in the summary of results used here, so the women's fall of 3.3 years should not be subtracted from the 2015 number and presented as a 2021 age. The drop is the drop. The level, for women, is not restated.
People aged 35 to 44, and people aged 55 and older, accounted for most of the years lost. Women contributed more to the fall than men. Those are the ages at which a household loses a parent, a worker, or an elder. A district figure of three years is, at that point, a person who is not at the next birthday.
The pattern matches the province in direction, not in a shared spreadsheet. The authors cite South African Medical Research Council estimates of 58,627 excess deaths in KwaZulu-Natal between May 2020 and January 2022. That is the whole province. uMkhanyakude is one rural district inside it. The study does not claim the district's rate and the province's count are the same thing.
The team linked death records to health screening collected from residents between 2018 and 2020. That let them compare death rates for people with and without chronic conditions. The comparison is a rate ratio: how many times higher the death rate was, not a percentage chance that a particular person would die.
Before the pandemic, people living with HIV died at 1.8 times the rate of HIV-negative people. During the pandemic the gap narrowed to 1.5 times. Diabetes moved in a similar way, from 1.6 times to 1.4 times. High blood pressure went the other way. The relative death rate for people with hypertension rose by 15% in the pandemic period. People living with HIV who also had hypertension had a death rate more than twice as high during the pandemic, a rate ratio of 2.18.
A narrower gap for HIV and diabetes is not the same thing as those conditions becoming safer in absolute terms. Deaths overall were about 60% higher than expected. A group can have a smaller relative gap and still lose more people, if the baseline of deaths has risen for everyone. The paper's point on hypertension is the one that sharpened: the relative rate went up, and it went up further for people who had both HIV and high blood pressure.
Excess mortality counts every death above the expected number. It does not count deaths confirmed as Covid-19. The authors note that without cause-of-death data they cannot separate deaths caused by the virus from deaths caused by what the epidemic did to everything else, including disrupted health services. A death from the virus and a death after care was disrupted would sit in the same excess figure. The study cannot say which was which.
The chronic-illness analysis covers only people who chose to attend the screening programme. They may not represent the whole district. Some of the subgroups were small. A rate ratio from a small group can move a long way on a few deaths. The authors say so, and the 2.18 figure should be read with that limit attached, not as a personal forecast.
Their conclusion is about planning. Pandemic planning in low-resource settings, they write, needs to be shaped around rural populations, and it needs to put the most vulnerable groups first. The groups the results point to are not abstract. They are adults in a rural district, especially people in mid-life and past 55, and people living with more than one condition, above all HIV together with hypertension.
None of this replaces advice from a clinic, a pharmacist or a doctor who knows the person. The study ends in 2021. It is not a reason to stop HIV treatment, blood-pressure treatment, or diabetes treatment, and it is not a diagnosis.
It is a record of how many extra years were lost in one district, in two waves, and of which conditions were linked to higher death rates while that was happening. The cause of each death is not in the data. The next question the paper itself leaves open is that one: how much of the loss was the virus, and how much was the care that did not happen around it.
Source: SA Health News